Survival Analysis#
This module has a single function, used to simulate data with a given cumulative survival function.
import numpy as np
from lifelines import KaplanMeierFitter
from ISLP.survival import sim_time
Define a cumulative hazard#
For simplicity we’ll use the the baseline \(H(t)=t\) which defines the exponential distribution.
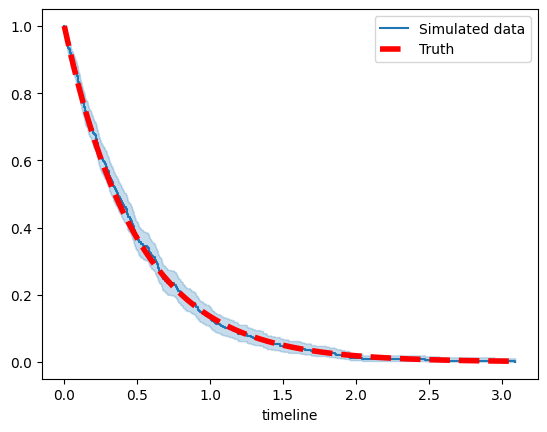
We’ll take as our linear predictor \(l=\log(2)\). This means we will observe draws from \(H_l(t)=2t\) which corresponds to an exponential distribution with mean 0.5.
cum_haz = lambda t: t
rng = np.random.default_rng(1)
T = np.array([sim_time(np.log(2), cum_haz, rng) for _ in range(500)])
Plot survival function#
kmf = KaplanMeierFitter(label="Simulated data")
kmf.fit(T, np.ones_like(T))
ax = kmf.plot()
Tval = np.linspace(0, T.max(), 500)
ax.plot(Tval,
        np.exp(-2*Tval),
        'r--',
        linewidth=4,
        label='Truth')
ax.legend();